Categories:
Precious Metals
Topics:
General Precious Metals
SP-500, GLD and GDX - Sentiment Trumps Everything
Markets rise when the preponderance of participants are buyers, and fall when the preponderance of participants are sellers. One of the key ways to anticipate the pendulum swings of participant behavior, and therefore price behavior, is to evaluate sentiment. Sentiment, more than fundamentals or technical analysis, trumps everything.
*
When too many players are on the same side of a trade they eventually find themselves in a crowded position where most everyone around them has the same motivation – to reverse their position when the tide changes.
*
Little by little, as participants slip out the back door by changing the bias of their position, the pendulum of price swings more sharply against the remaining herd in the crowded trade. Inevitably, something akin to panic sets into the herd as they begin to aggressively reverse their position for financial survival. The primary ingredient that causes price to catapult, up or down, is sentiment oscillation and capitalization from one sentiment extreme to the other.
*
An astute market technician, investor or trader will look for those flash points where conditions are ripe for a market reversal. It sounds easy to do, but remember that when the analysis is very convincing, the preponderance of market participants will disagree. It seems that to be effective at market timing one needs to listen not to what others are saying, but to what the sentiment data represents as truth.
*
With these thoughts as a foreword, let’s see what the current sentiment situation is for the SP-500.
*
The following chart is from Market-Harmonics and assimilates 4 years of bull/bear percentage data from Investor’s Intelligence. To this chart I have measured and notated in blue the percent change in bearish advisors per the Investor’s Intelligence data, for each downswing of the SP-500. My notation in green is the percentage change in bearish advisors for the related upswing of the SP-500. The price of the SP-500 is notated in black at each swing peak and trough.
*
One of the most striking observations I have made of this data is that it appears the maximum pendulum swing in the bearish direction is a 20% change. This occurred in Q1, 2008. More frequently this percentage change has topped out at 19%, followed by 16%, 11% and smaller percentage changes.
*
The obvious conclusion I come to is that our current bearish % change situation, at a 19% reading, is about at the maximum. History seems to show that investor’s emotions, like a physical rubber band, can only be stretched so far into pessimism (19-20%) - the bearish direction - before they snap back in the opposite bullish direction.
*
The pendulum swing in the bullish direction is about to begin at this very time. Click on the chart to ENLARGE
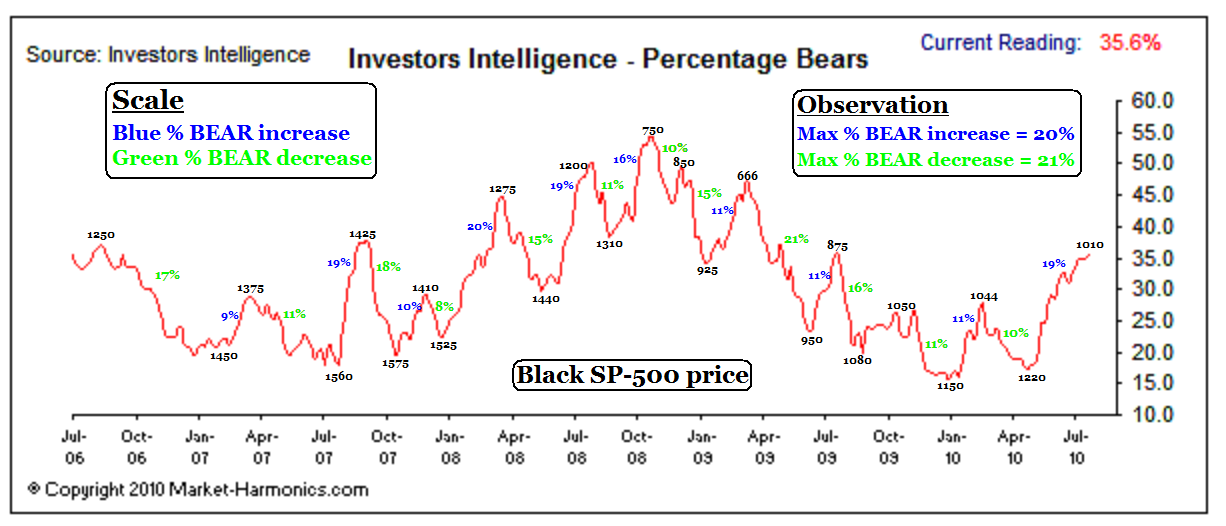
I would expect that the stock market could not possibly peak until the % of bears decrease by a minimum of 8%, and more statistically likely 10-15%. With a current reading of 36%, I am suggesting that we should not even consider a peak in the stock market until the bear percentage reading drops from where it is now at 36% to 28%, and more likely to around 26-21%.

If I were presently short gold and looked at this chart it would send shivers down my spine. No kidding. Nothing like finding out you are in a crowded trade that once it starts to go bad, you KNOW it will go very bad.